
Viewing Developer Logs
The Developer Logs page displays data logs of different services under three categories. These categories are as follows:
- Services
- Connectors
- Microservices
In the list of data logs, when you click a record of the data log, you can access detailed logs related to a service. You can click All Logs to download the detailed log report on related services. You can access the Developer Logs page as follows:
To view the developer logs:
- In the Observability module, see the Developers Logs page in the middle panel.
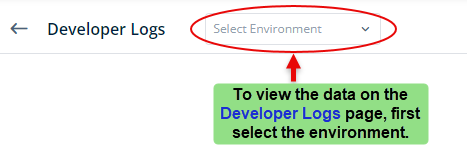
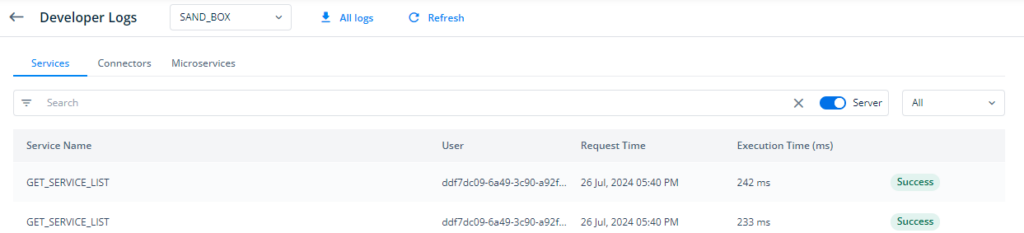
- After you select the environment, the Developer Logs page displays details of all types of services under the following tabs:
- Services
- Connectors
- Microservices
- Under these tabs, the Developer Logs module displays the following data values:
| Tabs | Description |
| Services Tab | Under the Services tab, you can view the developer logs of all types of services, including microservices, custom Java-based services, public vConnect APIs, and third-party connectors. |
| Connectors Tab | Under the Connectors tab, you can view developer logs of all third-party connectors, such as Google Map API, PAN authentication API, and others. |
| Microservices Tab | Under the Microservices tab, you can view developer logs of all REST type micro-services and other Java-based custom services. |
| Search | This box allows you to search the developer logs based on the following searching criteria: a. Duration:- This property allows you to search the logs by selecting pre-defined timeframes, such as last 5 min, last 15 min, last 30 min, etcetera. Also, you can define a specific timeframe by selecting start and end date and time after you select the Custom option. b. Limit:- This property allows you to define the maximum number of records (for example, 5) that the Developer Logs module will display to the user on a single page. c. Status:- You can use this property to view developer logs based on one of the following statuses of the service execution: 1. Success 2. Failure d. Service Name (Under Services tab):- Click in the Service Name box to select a service’s name if you want to search logs related to the selected service. In the Service Name box, you can enter the service’s name to find it in the list. e. API Name (Under Connectors tab):- In this box, enter the name of a Connector type API (for example, PAN Authentication) so that you can seearch logs based on the API name. f. Connector Type (Under Connectors tab):- Click this list to select a connector so that you can view logs based on the selected connector. Connectors are third-party APIs that are integrated with the Vahana platform. g. Microservice Type (Under Microservices tab):- Click this list to select the type of the microservice (for example, API Gateway). After you select a type of the microservice, the Developer Logs page displays logs related to the selected microservice. h. Record Identifier:- In this box, enter the record identifier to search logs based on record identifier. The record identifier is a unique value that identifies a service request or group of service requests at the runtime. i. User:- In this box, enter the user’s name who has consumed the service. j. Execution Time:- This property has two boxes, Greater Than and Less Than. You can define values in these boxes when you want to search logs based on a specific execution time frame. For instance, you can seearch logs of services that executed in less than 83 milliseconds. In this case, you will enter 83 in the Less Than box. k. Trace ID:- In this box, enter the trace ID to search logs based on trace ID. The trace ID is an alphanumeric value that the Vahana platform generates to trace the service request for debugging and status inquiries. |
| Field/Column | Description |
| Service Name | This column displays the service’s name (for example, GET_SERVICE_LIST). The Developer Logs module displays data logs for this service. |
| User | This column displays a long, dash-separated alphanumeric value. This value specifies the type of source that invoked the service, executed the service, or synced the service. The Vahana cloud internally generates this alphanumeric value, which is referred to as “User Name” in the Developer Logs module. When a service is invoked or executed, the source of service invocation or execution can be as follows: 1. Service Syncing:- If the user has synced the service in the Release Manager module, the User Name column displays the user’s email ID (for example:- shiva@decimal.co.in) who has synced the service. 2. Service Invocation from Application Build:- When a user performs the function in the application, the service is invoked as a result of user action. In this case, the User Name column will display the user’s login ID/user ID. 3. Service Testing on Postman:- When an IT Ops user tests the service on the Postman application, the User Name column displays a static value, Vahana. 4. Scheduler Executed Services:- When the Scheduler module executes a service at the schheduled date and time, the User Name column displays the Scheduler-exe value. |
| Record Identifier | This column displays the unique record identifier. When a user configures a service on the vConnect module, he defines the API request’s key (parameters) as the record’s primary key. 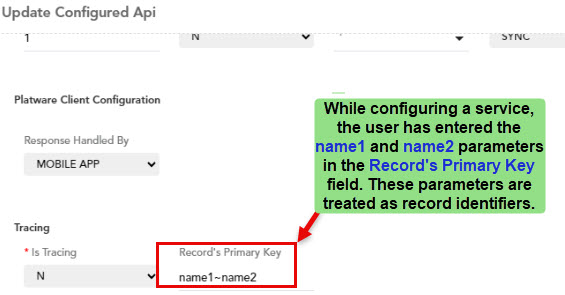 Thus, when a source application invokes a service, the API gateway generates developer logs as a result of the service call. The API gateway treats the record’s primary key as a record identifier. The API gateway manages developer logs based on the record identifier. Note:- When you define more than one Record’s primary key, you separate them by a tilde character (~). You can define the key as follows: #Expression1:- name1~name2 #Expression2:- $.name1~$.name2 |
| Request Time | This column displays the date and time at which the source component requests the service or executes the service. |
| Execution Time (ms) | This column displays the total time that an API takes to perform its job. This value is also referred to as TAT (turn around time). |
| Status | This column displays one of the following values: i. Success:- It means that the source component successfully invoked or executed the service. ii. Failure:- It means that the source component failed to invoke or execute the service. |
| Connector Type (The first list under the Connectors tab) | This field comes into view when you click the Connectors tab. This field displays different types of connectors that consumes third party APIs. These connectors are virtually configured on the Vahana platform. When you click this list, it displays the different categories of connectors, such as Vahana Hub, REST SOAP API, Passthrough API, and others. These categories are internally defined in the elastic search database. After you click the Connector Type list, select a category (for example, Passthrough API), and the Developer Logs page displays the list of all connectors under the selected category. You can use the Connector Type list to view the list of connectors under a specific category. Thus, you can access the data of these connectors for debugging purposes. |
| Microservice Type ((The first list under the Microservices tab) | This field comes into view when you click the Microservices tab. When you click the Microservice Type list, it displays inbuilt categories of microservices. These categories are also defined in the elastic search database. After you click the Microservice Type list, select a category (for example, Sync Engine), and the Developer Logs page displays the list of all microservices under the selected category. You can use the Microservice Type list to view the list of microservices under a specific category. Thus, you can access the data of these microservices for debugging purposes. |
| Status (A list under the Services, Connectors, and Microservices tab) | When you click this list, you can view developer logs based on one of the following statuses: a. Success b. Failure c. Not Available |
To view detailed logs of a service, click here.
Was this article helpful?
YesNo