
Introduction (View Detailed Logs)
View Detailed Logs is a web based API call tracing tool. You can access the View Detailed Logs module to view and observe the API’s request and response data. You can apply several filters to view and observe a specific set of call logs.
You can use the following filter-based criteria to search and view a specific set of audio logs:
- User Name
- Service Name
- Status
- Execution time
- Limit and Trace ID
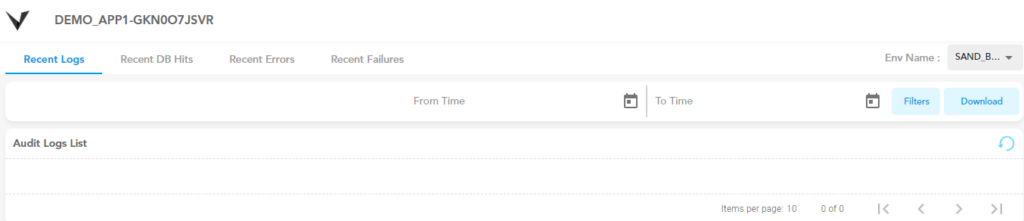
On the View Detailed Logs module, you can perform the following functions at the broad level:
- Viewing recently generated Logs
- Viewing recently generated errors
- Viewing failed transactions
- Downloading audit log report
- Viewing audit logs based on the selected environment
Accessing View Detailed Logs Module
To help you manage and monitor bulk log-related data, the VRT (Vahana Run Time) portal incorporates the View Detailed Logs module. Apart from the View Detailed Logs module, it incorporates other sub-modules, such as Event Analytics, Scheduler, Monitoring, and others. To access the View Detailed Logs module:
- On the Vahana portal’s dashboard, see the VRT Portal tile.
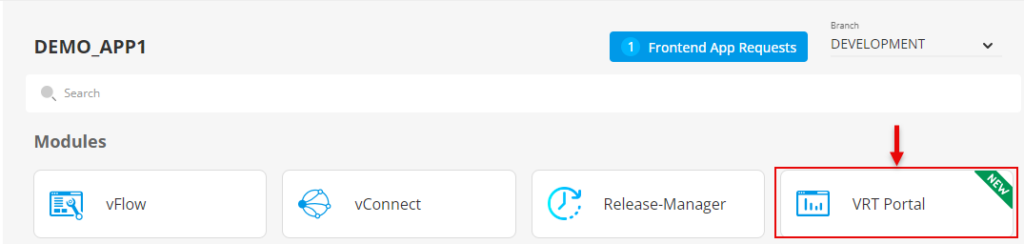
- Click the VRT Portal tile, and the Vrt Portal page opens.
- On the Vrt Portal, see the right panel.
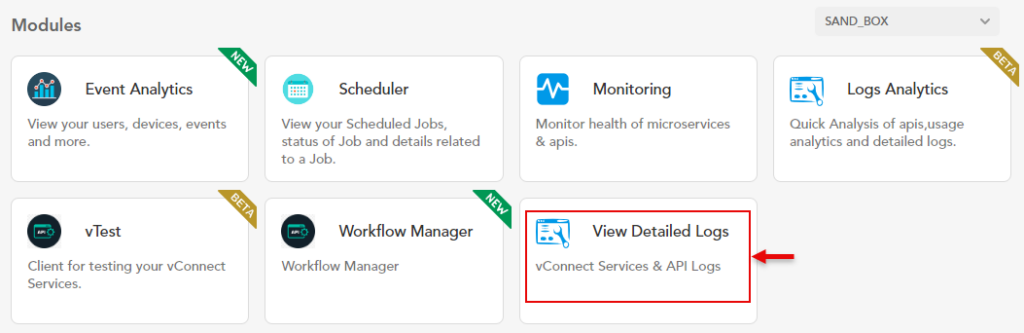
- In the right panel, under Modules, click the View Detailed Logs tile, and the View Detailed Logs module’s home page opens.
Was this article helpful?
YesNo