
Debugger 2.0
Introduction
The Debugger in vFlow 2.0 is a tool for analyzing and troubleshooting runtime applications. It allows users to inspect application configurations, including pages, system components, components, and elements, and compare backend configurations with application settings. It also provides details on user data, temporary objects, entities, and event executions.
The Debugger includes an interface for navigation, task charts for visualizing processes, and structured data organization to assist in debugging and application analysis.
Key Features
- User Interface
Structured layout for inspecting configurations, events, and data. - Task Charts
Visual representation of tasks using chart views. - Info Panels
Configuration panels with tabbed sections for viewing properties set in vFlow. - Data Organization
Categorization of user data, entity data, and temporary data for structured navigation. - Error Handling
Displays a red error message strip above the Task JSON viewer when a task fails.

Steps to Use Debugger 2.0
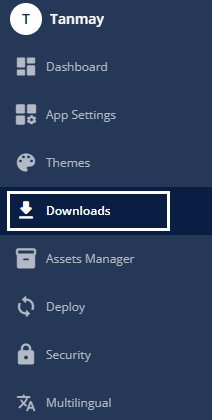
1. Enable Debugger
- Navigate to the application dashboard.
- Go to the Download in the L1 menu.
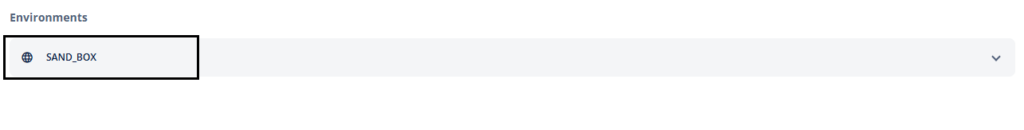
- Click Environment to open it’s download settings.
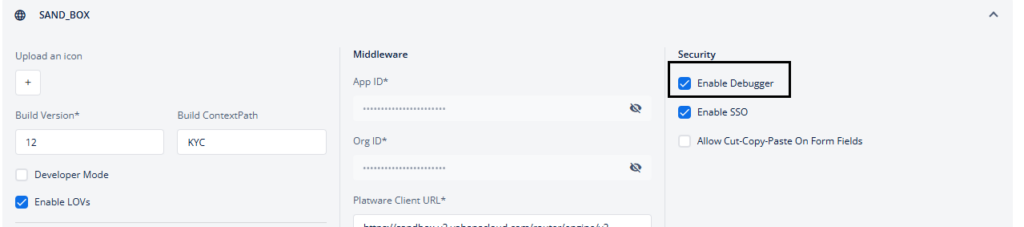
- Click to check the Enable Debugger checkbox under the Security section.
2. Access Diffferent Sections of Debugger 2.0
Debugger 2.0 is divided into three main sections:
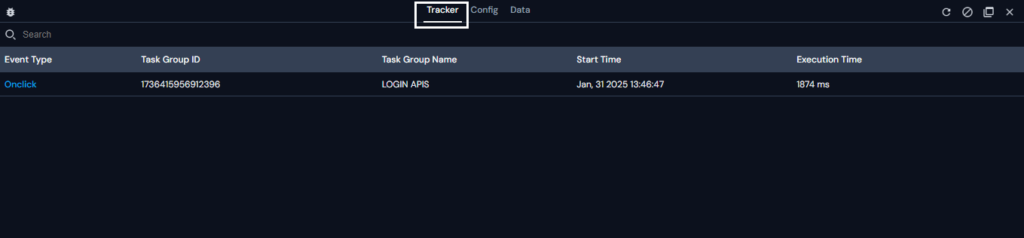
2.1 Tracker Tab
The Tracker section allows users to track events that triggered at the page level based on user actions.
2.1.1 How to use tracker
When you access the Tracker, the first view is a table displaying key details about executed events. The table consists of the following columns:
- Event Type: This column shows the type of events, such as onclick, onload, onselect, et-cetera.
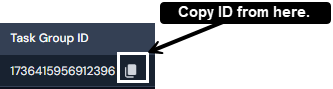
- Task Group ID: It is the unique ID of the task group that you create and configure under the event. You can also copy this ID.
- Task Group Name: The column contains the name of the task group that is executed for the particular event.
- Task Group Type: This column indicates whether the task group is
SequentialorConditional. - Start Time: It indicates at what time the event was triggered.
- Execution Time: This column represents the total time taken by the task from the time the event was triggered.
When you click any row in the Tracker table, additional information opens, displaying a list of tasks under the selected Task Group.
This entire view allows you to examine the tasks associated with the task group and switch between the task groups. However, since there can be two types of task groups, namely sequential and conditional, the view for both task groups varies.
View 1. If the selected Task Group Type is Sequential, the expanded view displays the list of tasks in sequence. The columns in this view include:
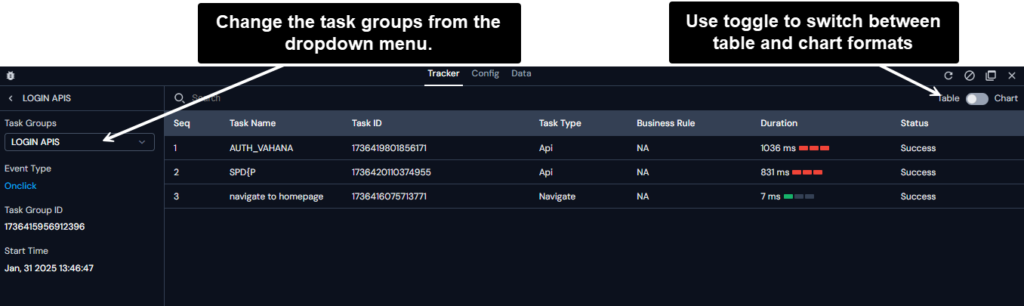
- Task Name: It displays the name of the task within the task group.
- Task ID: It shows the unique identifier assigned to each task under the task group.
- Task Type: It indicates the type of task being executed.
- Business Rule: It displays the execution status of business rule associated with the task.
- If no business rule is mapped, the debugger displays “NA”.
- If a business rule is mapped but the user action doesn’t satisfy the condition in the business rule, the debugger displays “F”.
- If a business rule is mapped and the user action satisfies the condition in the business rule, the debugger displays “T”.
- Duration: It represents the time taken (in miliseconds) for the task execution.
- Status: It shows the execution status of the task (e.g., Success, Failure, and Pending).
View 2. If the selected Task Group Type is Conditional, the expanded view displays only the executed blocks within the task group (i.e., If, Else If, Else). Skipped blocks are not shown. The view is divided into three key sections:
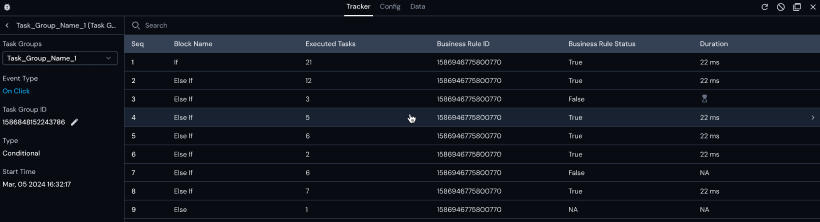
If-Else Block Table
This section lists all executed blocks in order. The table includes the following columns:
- Sequence (Seq): Indicates the order of the block in the task group.
- Block Name: Displays the block type —
If,Else If, orElse. - Executed Tasks: Number of tasks that were executed in the block.
- Business Rule ID: ID of the business rule mapped to the block, or
NAforElseblocks. - Business Rule Status: Indicates whether the business rule was satisfied:
"True"if the rule is evaluated to be true,"False"if it is evaluated to be false (block skipped),"NA"if no business rule was mapped (typicallyElse).
- Duration: Total execution time for the block. If the block is still running, a delay icon is shown.
Note: Once a block with a True business rule is found, the debugger skips all subsequent blocks in the flow. These skipped blocks are not listed in the Tracker.
Block Details
Clicking any block in the If-Else Block summary table reveals additional metadata:
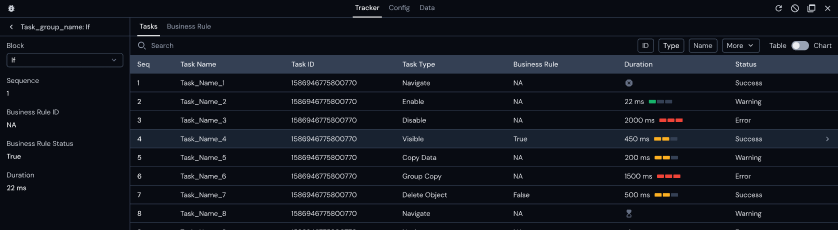
Left Panel
- Task Group Name: Block Name (Header), whose data is opened on the right panel.
- Sequence: Block’s sequence number in the group.
- Business Rule ID: If applicable.
- Business Rule Status: Indicates
"True","Fasle", or"NA". - Duration: Execution time of the block.
A block dropdown is available for navigating between other executed blocks.
Right Panel
Depending on the block and its execution, one or both of the following tabs appear:
- Tasks Tab: Lists the tasks executed within the block, with the same columns as sequential task groups (Task Name, ID, Type, Business Rule status, Duration, Status).
- Business Rule Tab: Visible only for
IfandElse Ifblocks where a business rule is mapped. It includes:- ID: The business rule’s identifier.
- Statement: The logic or expression used in the rule.
- Result: Whether the rule evaluated to
"True"or"False". - Resolved State: Final state of the rule after runtime evaluation.
If a business rule was evaluated but did not execute any tasks (i.e., "False"), only the Business Rule Tab appears for that block.
Example: Suppose you have a Conditional Task Group with:
1. If (BR1) – Evaluates to False
2. Else If (BR2) – Evaluates to True → Executes tasks
3. Else – Skipped
When you click on the “If” block, the debugger:
– Does not show any tasks (since none were executed).
– Shows only the Business Rule tab, to explain why the block was skipped.
This helps users trace why a block did not run — it was skipped due to the rule evaluating to False.
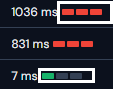
Task Execution table for duration analysis:
| Duration Logic | Color and Bars | Representation | Description |
| 0 – 200ms | Green (1 Bar) | Green color signifies that the task execution duration was as expected. | |
| 500+ ms | Red (3 bar) | Red color denotes that there was a long delay in the execution of the task. | |
| 201-500 ms | Orange (2 bar) | Orange color shows that there was slight delay in the task execution. | |
| – | – | This icon displays the scenario when the task execution is failed. | |
| – | – | This icon specifies the scenario when of task execution is pending. |
When you click any row in the task table, it displays detailed configurations on the task, such as its config, request data, response data, and others.
2.2 Config Tab
The Config section helps users check page, system component, component, and element configurations.
2.2.1 How to use config
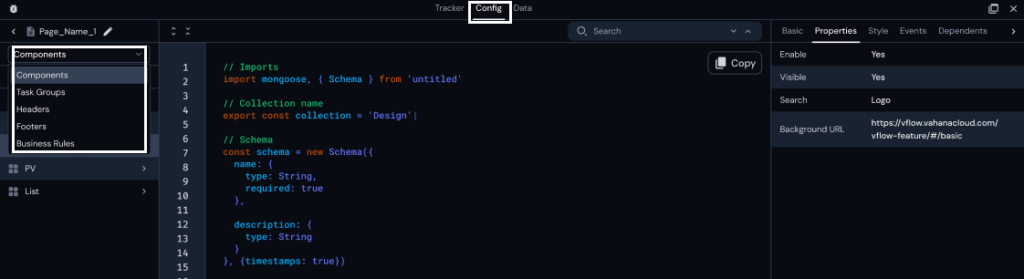
When you access config, you see three panels:
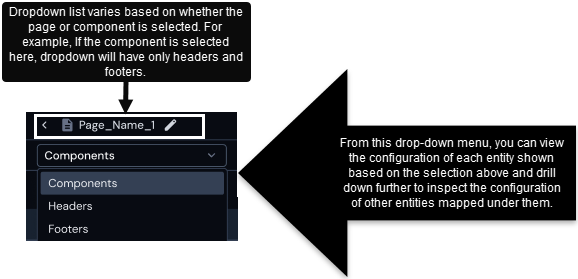
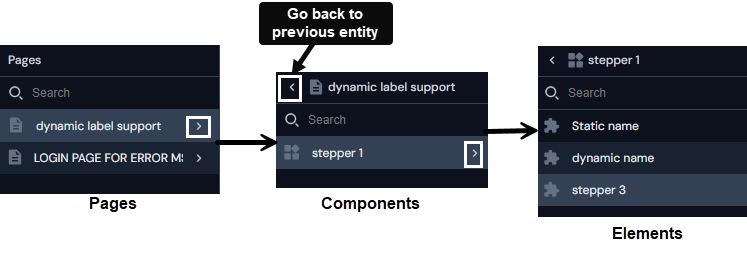
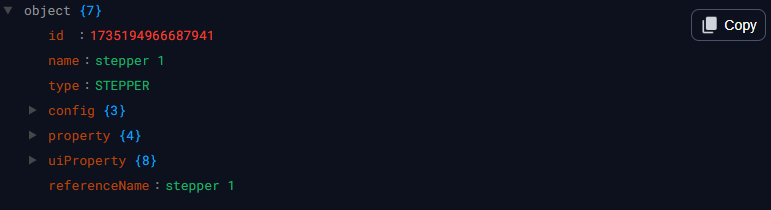
- Entities Panel / Left Panel: By using the entity panel, you can access different entities including page, system component, component, and element in a drill-down manner. For instance, you can use the entity panel as follows:
- On the pages menu, click arrow icon
 to the right of the page (for example: dynamic label support) to display different components.
 - In the list of components, click arrow icon to the right of the component (for example: stepper 1) to display different elements (for example: Static name, dynamic name, and stepper 3).
- On the pages menu, click arrow icon
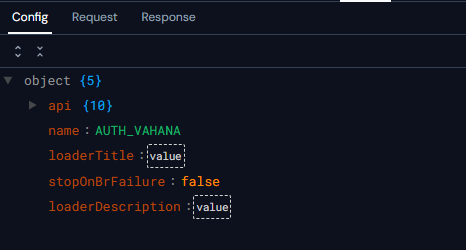
- Config Panel: This panel displays the configuration detail of a specific entity selected in JSON format.
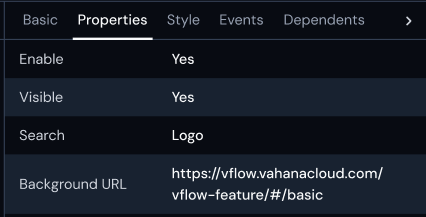
- Properties Panel / Right Panel: In this panel, you can check the data related to the basic and advance properties, style and animation properties, configured events, and data source at the page, component, and element levels.
NOTE: When a user selects a subcomponent item in Fieldset or List, the debugger will display the mapped component‘s configuration
and allow navigation into its nested elements.
Similarly, in the case of Tab and Stepper, clicking on a Tab or Stepper will take the user directly to the mapped page/sub-page and allow further navigation into its structure, just like with regular pages.
2.3 Data
The Data section provides insights into different data types.
2.3.1 How to use Data
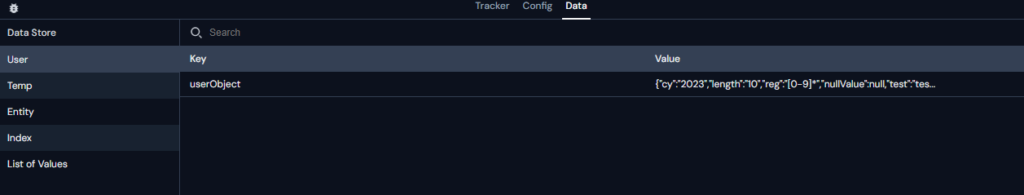
When you access the Data tab, it displays two panels as follows:
- The left panel: It displays the list of Data Store
- The right panel: It displays the data stored in the data source in Key and Value format.
Steps:
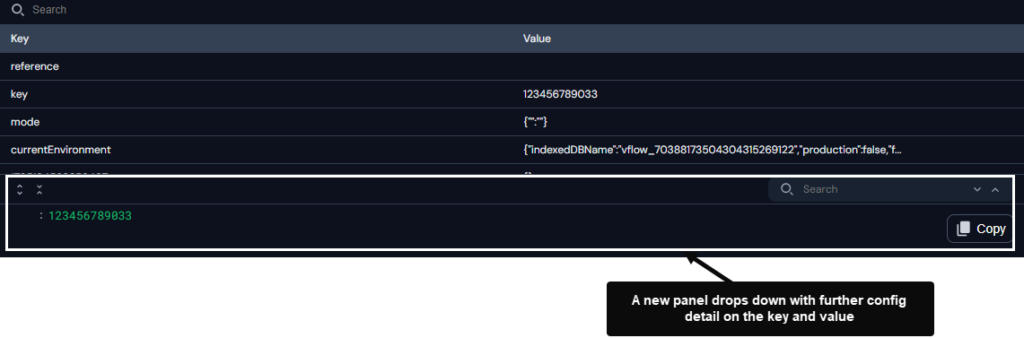
- After you click a data store item, the right panel displays the data in key and value format.
- When you click a row in key and value panel, it opens a new panel, which displays the second-level data stored in the JSON object.
Additional Notes
- Duration Logic: Execution time is categorized into green, orange, and red for performance analysis.
- Pop-out View / Maximise Button: You can view the debugger 2.0 in a separate pop-out window by clicking the maximise button (
 ), located on the top-right corner of the debugger 2.0 window.
- Put your mouse pointer on the title bar, press left mouse button to drag the window.
- Reload Debugger Button (
 ): Reloads data in all the sections.
 - Clear Data Button (
 ): Clears data in the Tracker section.
 - Close Button (
 ): Exits the debugger.