Monitoring
In the Observability module, the Monitoring module gives you a quick snapshot of “up” and “down” microservices and groups of vConnect services. This helps you determine the current performance and health index of the microservices and vConnect services’ groups. If you find a service or vConnect services group down, you can take a corrective measure to make them up and working as expected.
You need to understand these two different terms: Microservices and Service Groups. The microservices are custom Java-based services that are deployed on the VRT (Vahana Run Time) module. Similarly, service groups are created on the vConnect portal. A service group works as a virtual container that contains one or more configured public APIs.
To monitor a microservice or vConnect service group, you need to access the APIs Monitoring module on the middleware portal and then add one or more microservices and service groups so that you can monitor them. This post focuses on how to monitor a service by viewing and observing its data. In the Observability module, the Monitoring page allows you to monitor data by using indicator-based status values.
To monitor the status of services:
- In the Observability module, see the left navigation panel.
- In the left navigation panel, click the Monitoring icon (
 ), and the Monitoring page opens.

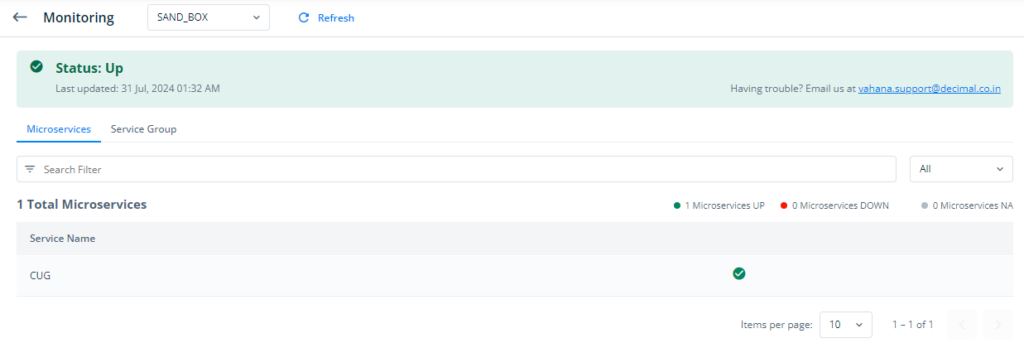
Note:- To view the status of micro-services and service groups in another environment, click the SAND_BOX list and then select an environment. After you select the environment, the Monitoring page displays a list of under-monitoring services that were configured under the selected environment.
On the Monitoring page, the light blue bar displays the current status of the microservice, which is Status: UP.

If you see downward, you will find two tabs as follows:
- Microservices
- Service Group
After you click the Microservices tab, it displays the list of under-monitoring microservices with their statuses. These microservices are deployed on the VRT module.

If a microservice is down, the Monitoring page will display the red circle that encloses the white cross sign. If the current status of the microservice is not available, the Monitoring page will display the grey circle that encloses the dash sign.
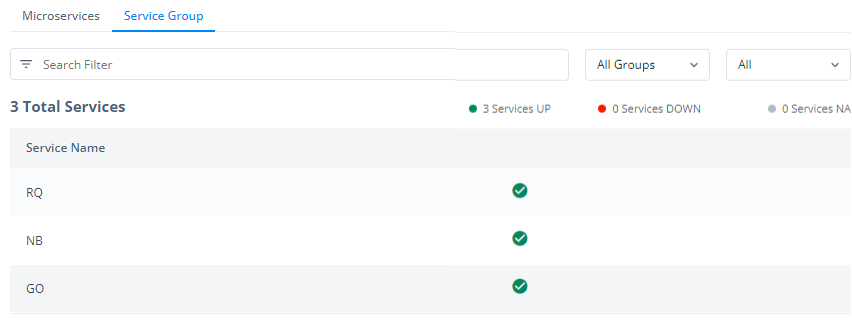
When you click the Service Group tab, the Monitoring page displays the list of service groups. On the Vahana platform, a service group is a virtual container that contains one or more vConnect APIs. These APIs are configured on the vConnect portal and exposed to the API marketplace. These public APIs are used to consume third-party APIs.

In the above screen capture, you can see the list of three service groups. If you see right to the name of these services, you can find their current status as “up.” It means that all APIs in these service groups are up and working fine.
In relation to the functional status of microservices and service group, the Status area can show one of the following statuses:
Case1:- When the microservice is down and all APIs in the service group are up, the Status area will display: Down.
Case2:- When the microservice is up and one of the APIs in the service group is down, the Status area will display: Partially Up.
Case3:- When the microservice is up and all APIs in the service group are also up, the Status area will display: Up.

