Viewing Detailed Service Logs
The Developer Logs page displays service-related logs in list format. This list displays the first-level information. In the list, if you click a specific record, you will access broad-level information about the service log. This broad-level information includes the following:
- Trace ID
- End-point URL
- User ID
- Request and Response Payload
- Overhead (Request’s header data), and others
To view the broad-level developer logs:
- On the Developer Logs page, under the Name column, find the service’s name to view its data logs.
Note:- If the Developer Logs page displays two or more records of a single service, see a specific date and time under the Request Time column to view data logs of a specific record. This is the time at which the source component requested or executed a service.

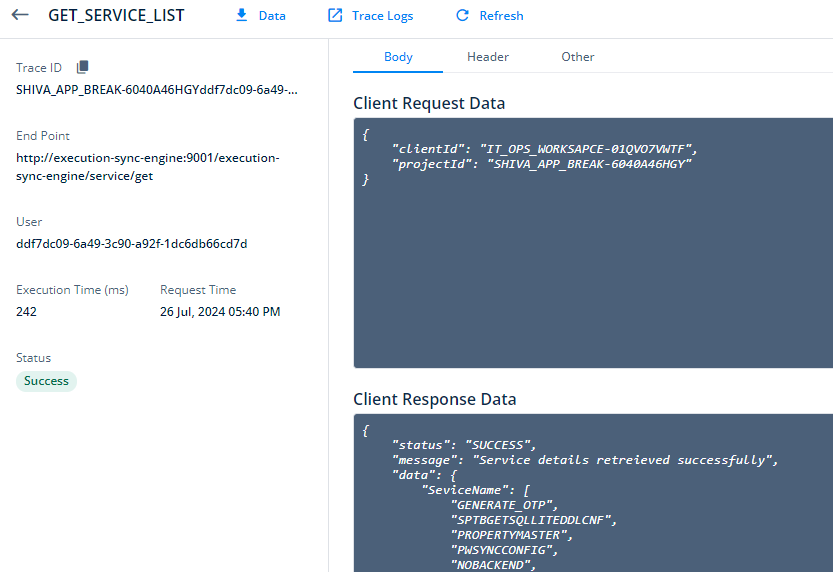
- After you find the service’s name (for example, GET_SERVICE_LIST), click it or click its record, and a <<Service Name>> page open.
- On the <<Service Name>> page, the left-middle panel displays the following data:
| Data | Description |
| Trace ID | This alphanumeric value is a unique trace ID that the Vahana platform generates when an API request is processed. This trace ID is used to track the route of the API and helps debug the API request if it fails to perform the function. |
| End Point | This value specifies the URL location. The source application or medium posts the API request to this URL, or an API is invoked from this URL. |
| User | This dash-separated alphanumeric value specifies the user ID of the user who initiated the application request. |
| Execution Time | This value specifies the total time that the API takes to perform its job. |
| Request Time | This time stamp value specifies the date and time at which the user invoked the API. |
| Status | This field contains the status of an processed API as follows: a. Success b. Failure |
- On the <<Service Name>> page, the middle panel displays the following data:
| Data | Description |
| Tab | Body |
| Client Request Data | This box displays the API’s request payload, or API’s request body, which contains the actual data. On the basis of the request’s body, the API returns the response to the end-user. |
| Client Response Data | This box displays the API’s response payload. It contains the response that the API returns to the end-user. |
| Tab | Header |
| Client Header | This section contains the header data. The API request’s header is used for request authentication. It contains the data related to the API’s source and destination. |
| Tab | Other |
| Other Data | The Other Data box displays the additional data, such as URI parameters, path parameters, etc. |

- On the <<Service Name>> page, the top panel displays the following utilities:
| Utility/Link | Description |
| Data | Click this link to download the API request and response in a (.txt) file. |
| Trace Logs | Click the Trace Logs link to display the Trace Logs Chart box. The Trace Logs Chart box displays a bar chart. When you put the mouse-pointer on the bar, it shows two values, which are described as below: a. TAT (Turn Around Time):- This value specifies the total time that the Vahana platform takes to process the request. The processing includes the time from receiving the request to returning the response. b. Actual Time Taken:- This value specifies the total time that a microservice takes to process the request. |
| Refresh | Click Refresh to refresh the <<Service Name>> page. |

- On the <<Service Name>> page, the bottom panel displays the following utilities:
| Utility | Description |
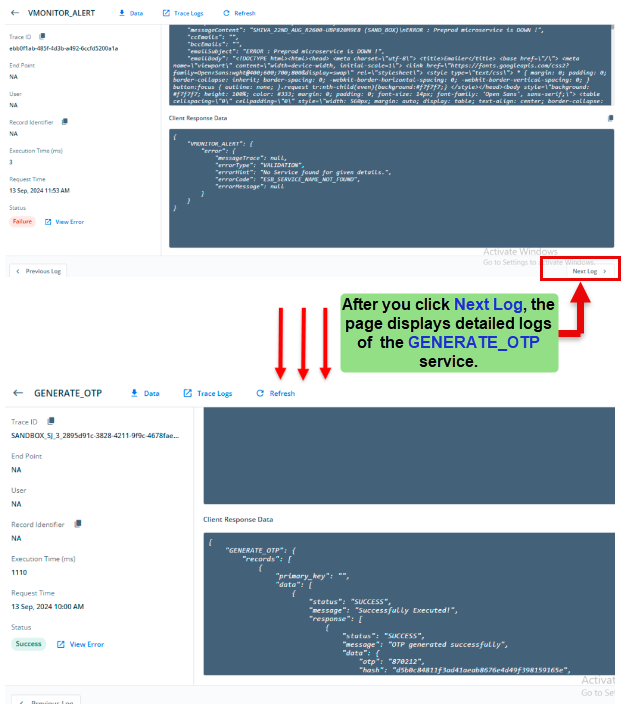
| Previous Log | You can find this utility in the bottom panel of the page. When you click Previous Log, the <<Service Name>> page displays detailed logs of the previous record in the list on the Developer Logs page. |
| Next Log | You can also find this utility in the bottom panel of the page. When you click Next Log, the <<Service Name>> page displays detailed logs of the next record in the list on the Developer Logs page. |


Trace Logs Details
On the Developer Logs page, when you click the record of a specific service, the <<Service Name>> page opens. On the <<Service Name>> page, click the Trace Logs link to display the Trace Logs Chart box. The Trace Logs Chart box displays a bar chart related to different micro-services, such as API Gateway, ESB, DBES, and others. These micro-services play a specific role to process the service request. In the Trace Logs Chart box, when you click a bar chart, it displays the following data:
| Field | Description |
| Span ID | The span ID is a unique value that contains alphanumeric characters. The Vahana platform generates a unique Span ID when a specific micro-service (for example, API Gateway or ESB) processes the service request. This unique Span ID is used to trace and observe the service logs related to a specific microservice. |
| API Name | This field displays the name of API that the source application invokes or executes at the scheduled time. The source application will invoke the API as a result of end-user’s action or scheduler module can execute the API at the scheduled time. |
| Execution Time | This field displays the timeframe that the related micro-service (for example, ESB) takes to process the service request. See the following screenshot. |
| Request Time | This field displays the date and time at which the source application invoked or executed the API. |
| Status | This field displays the final status (for example, Success) of the service request. |
| Download Icon ( | When you click the Download icon (( |
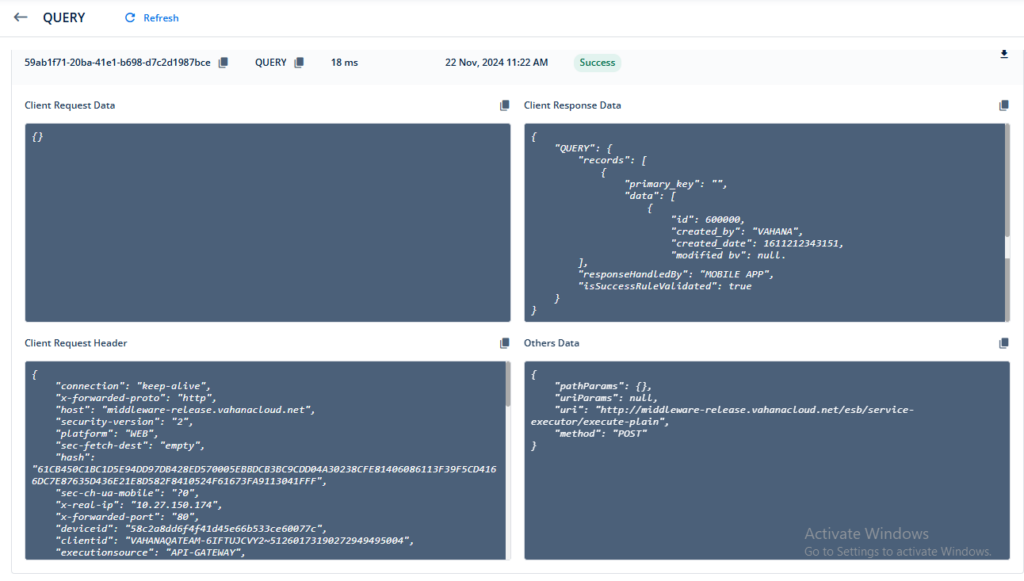
| Client Request Data | This box displays the request payload. It contains the actual data that the client application requests to the server. |
| Client Response Data | This box displays the response payload. It contains the actual data that the server returns to the client application. |
| Client Request Header | This box displays the request’s header data. It contains the data related to the request authentication, content-type, content-length, information about the resource of request, such as device ID, device type, and others. |
| Other Data | This box contains the additional data. This data is added to the API request when you design a complex structure of an API request. The complex API request contains the request transformation template that you implement in the vConnect module to calculate a specific value. You can define a complex API structure when you configure the API’s end point details in the vConnect module. To know more about the Request Transformation Template, visit the post: Request Transformation. |
Trace Logs Chart (Screenshots)


