
Scheduler
Under Observability, the Scheduler sub-module displays the list of scheduled jobs. These jobs are scheduled by using the Scheduled Jobs module in the middleware portal. On the other hand, the Scheduler sub-module only aggregates and displays the data of all services that have been earlier scheduled by using the Scheduled Jobs sub-module. You can view details of scheduled services as follows:
Viewing Scheduled Jobs
- In the Observability module, see the left navigation panel.
- In the left navigation panel, click the Scheduler icon (
 ), and the Scheduler page opens.
 - The Scheduler page displays the list of scheduled services in the Sand_Box environment.
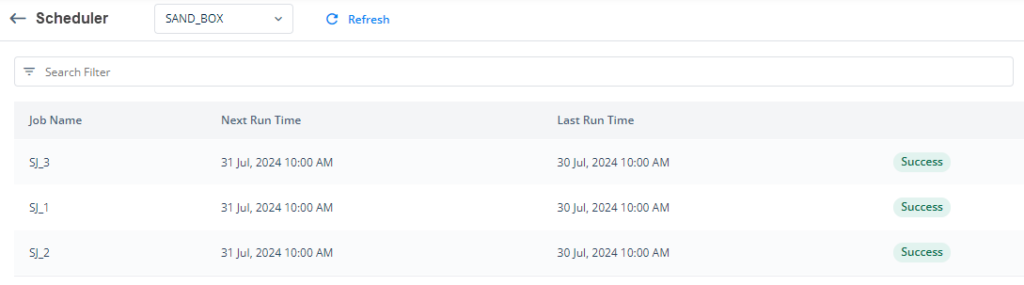
Note:- If you want to view the list of scheduled services in another environment, go to the upper panel and then click the Sand_Box list to select another environment. After you select another environment, the Scheduler page displays a list of scheduled services. These services were configured under the selected environment.
The Scheduler page displays the following details of scheduled services:
| Field/Column | Description |
| Job Name | This field displays the name of the scheduled job. |
| Next Run Time | This field displays the next scheduled date and time at which the job will run. |
| Last Run Time | This field displays the last scheduled date and time at which the job was run. |
| Fourth Column | This unnamed column displays one of the following statuses of the scheduled job: a. Success b. Failure c. Not Available |
Viewing Scheduled Job’s Details
On the Scheduler page, when you click the record of a specific job, the <<Job Name>> page opens. The <<Job Name>> page displays the broad-level details of a scheduled job as follows:
| Field/Property | Description |
| Left Middle Panel | |
| Job Name | It displays the scheduled job’s name. |
| Last Run Time | It displays the date and time at which the scheduled job was last run. |
| Next Run Time | It displays the next date and time at which the scheduled job will run. |
| State | This field displays the current state of the job. The job’s state specifies that the job was run recently or will run soon. |
| Right Middle Panel | This panel contains the scheduled job’s details under the following tabs: a. Last Executed b. Job History |
| Last Executed tab | This tab contains data related to the last executed job. This data is described as follows: a. Start Time:- It specifies the date and time at which the scheduled job started running. b. Finish Time:- It specifies the date and time at which the scheduled job was finished. c. Execution Time Taken:- It contains the timeframe in milliseconds. This timeframe specifies the total time that the schedule jobs takes from start to finish. d. Execution Retries:- This field contains a numeric value. This value specifies the total number of attempts that the scheduler makes to run the scheduled job. e. Job Processor Request ID:- This unique request ID is generated on the Vahana platform as a result of scheduled job’s execution. You can use this processor ID to search for a specific set of data in the developer logs. f. Input Service Request ID:- If you have configured two or more services in a scheduled job, a unique request ID is generated as a result of the first service’s execution. This unique request ID is stored in the Input Service Request ID field. g. Success Record Count:- This field contains a numeric value. This value specifies the total number of successful records that the scheduled job returns in the response. h. Failure Record Count:- This field contains a numeric value. This value specifies the total number of failed records that the scheduled job returns in the response. i. Total Record Count:- This field displays the total number of records that the scheduled job returns in the response. j. Execution Status:- This field displays the status of the scheduled job. The status can be as follows: a. Success b. Failure c. Not Available k. Execution Remark:- This field displays the execution remark (for example, Service Executed Successfully). The values of properties, such as Execution Status and Execution Remark, are encoded or configured at the database level. The Scheduler page displays these values based on the result of the scheduled job. l. Initiated via:- This field displays the name of the module or application that initiated the execution of the scheduled job. |
| Job History tab | When you click this tab, it displays the list of latest five records related to the execution of currently accessed scheduled job. In the list, it displays the following details of a record: a. Last Run Time b. Execution Status c. Success Record d. Failure Record e. Initiated Via f. Job Processor Request Id g. Input Service Request Id You can see the description of these details in the description of the Last Executed tab, which is given in the last row. |