
Events
Introduction
In the Analytics module, the Events section allows you to see a graphical representation of the number of occurrences of different events. Let’s have an example of opening a current account. Since the process to open a currrent process involves several stages such as PAN verification, and Aadhar Verification, you can see data related to events at one place.
To make more effective comparisons of event frequencies, you can select multiple events simultaneously. However, to maintain clarity and avoid confusion, you can select a maximum of five events at a time.
How to Access the Events Section?
To access the Events section:
- On the Users and Devices page, see the left navigation panel.
- In the left navigation panel, see the Events icon (
 ).
). - Click the Events icon to display the Events page.
- On the Events page, see the left Events panel.
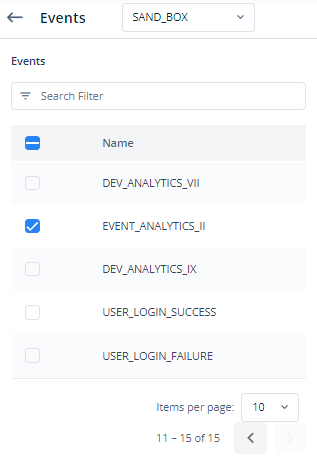
- The Events panel displays the list of configured events.
Note:- In the upper panel, if you click the SAND_BOX list and then select another environment, the Events panel displays a new list of events. These events are mapped to the services that were configured under the selected environment.
- In the Events panel, you can do the following:
- Click the left check box to select an event, and the middle panel displays a line graph. The line graph displays the number of the event’s occurrences at different dates.
- Click two or more check boxes to select related events so that you can compare these events with respect to occurrences on different dates.
Note:– You can use the Search Filter to find a specific event or you can manually search it by going through different pages of events.
The middle panel displays the line graph as follows:
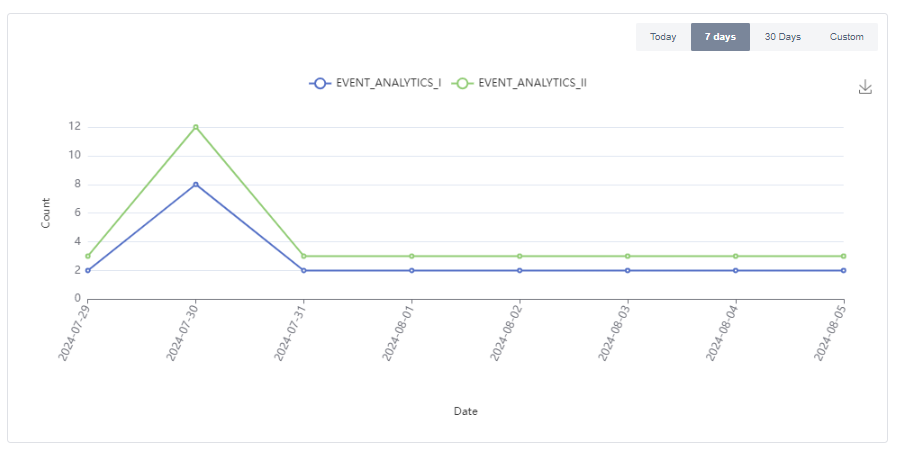
Components of a Line Graph
- The vertical axis (y-axis) represents counts of events, while the horizontal axis (x-axis) shows the dates on which the events occurred.
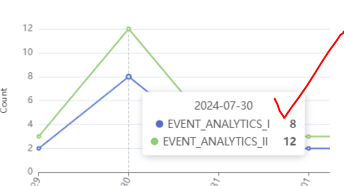
- For more precise data analysis, put your mouse pointer on the “dots” on the graph, as shown below.
- You can choose to view data for today, the last 7 days (default), the last 30 days, or a custom range of days, as shown below.
