An Introduction to IT Ops
IT Ops is a web-based module integrated with the Vahana cloud. It is an enhanced and improved version of the VRT portal. Earlier, the VRT portal did not offer efficient and comprehensive information management and a hierarchy to observe and monitor data. Many other modules, such as Observability, AppOps, and Analytics, were standalone modules. Thus, the Vahana portal user had to switch between these modules to access specific information types, such as users’ activities on the web and mobile applications, API performances, health checks of several components in the Vahana cloud, and others.
Contrary to the functional workflow of the VRT portal, the IT Ops module is a smart, faster, and full-fledged web-based module that offers proper information segregation and allows a user to monitor all types of data through a single panel. Also, the VRT portal lacked UI capabilities in terms of functional usage. To bridge this UI-specific inability, the IT Ops module provides a cohesive and easy-to-use set of user interfaces so that a user can effectively monitor services’ performances and timely rectify application-related problems.
The IT Ops module provides dedicated panels and dashboards to monitor and observe data in empirical and intuitive graphical formats.
Conclusively, IT Ops module offers the following functional benefits in the cloud-based business ecosystem:
- Improved set of user interfaces to conform Vahana cloud standards and provide better user experience
- Logically grouped dedicated sub-modules (AppOps, Observability, etc) to provide seamless and uncluttered user journey
- Enhanced modules, such as developer logs with the newly incorporated features
- Better monitoring experience through comprehensive web-based reports and graphs and charts
- Multiple searching criteria to efficiently monitor and detect a specific chunk of data
Accessing IT Ops Module
You can access the IT Ops module as follows:
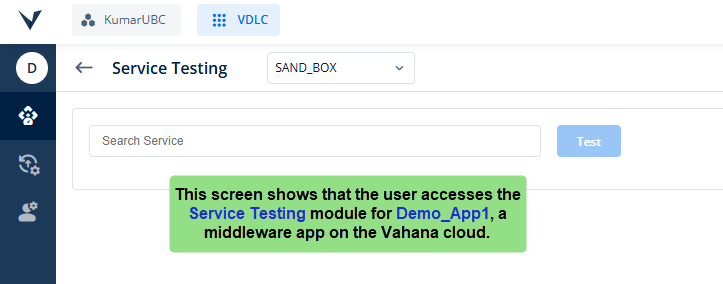
- On the Vahana portal’s dashboard, see the top panel.

- In the top panel, see the VDLC (Vahana Development Life Cycle) box.
- Click the VDLC box to display a context menu.
- On the context menu, click Operations and Maintenance to display the following menu items under Operations and Maintenance:
- App Ops
- Observability
- Analytics
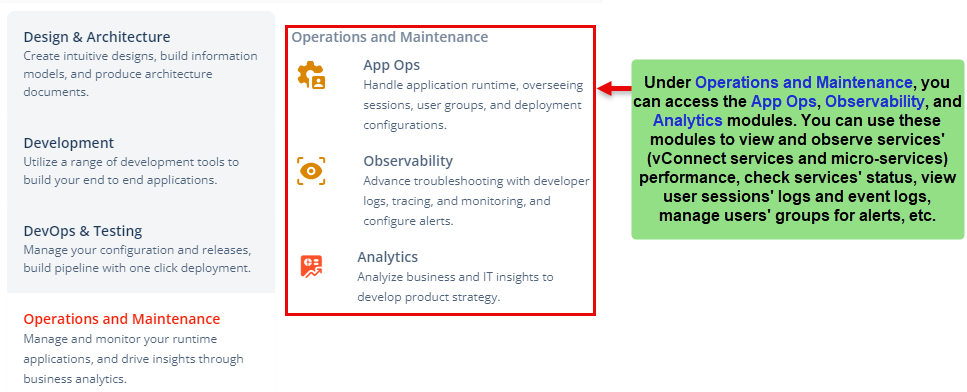
- Under Operations and Maintenance, click App Ops or Observability, or Analytics to display the Applications dashboard.
- On the Applications dashboard, search and find the application so that you can view data related to this application.
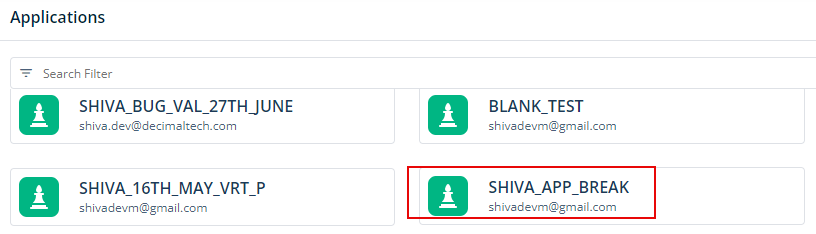
- After you find the application (for example, SHIVA_APP_BREAK), click it, and one of the following modules opens:
- If you click App Ops in step 5, the App Ops module opens.
- If you click Observability in step 5, the Observability module opens.
- If you click Analytics in step 5, the Analytics module opens.